Case study · Web performance intelligence
Econiscore
Designing a transparent benchmarking platform that turned complex website-performance data into clear, comparable decisions for media organizations.
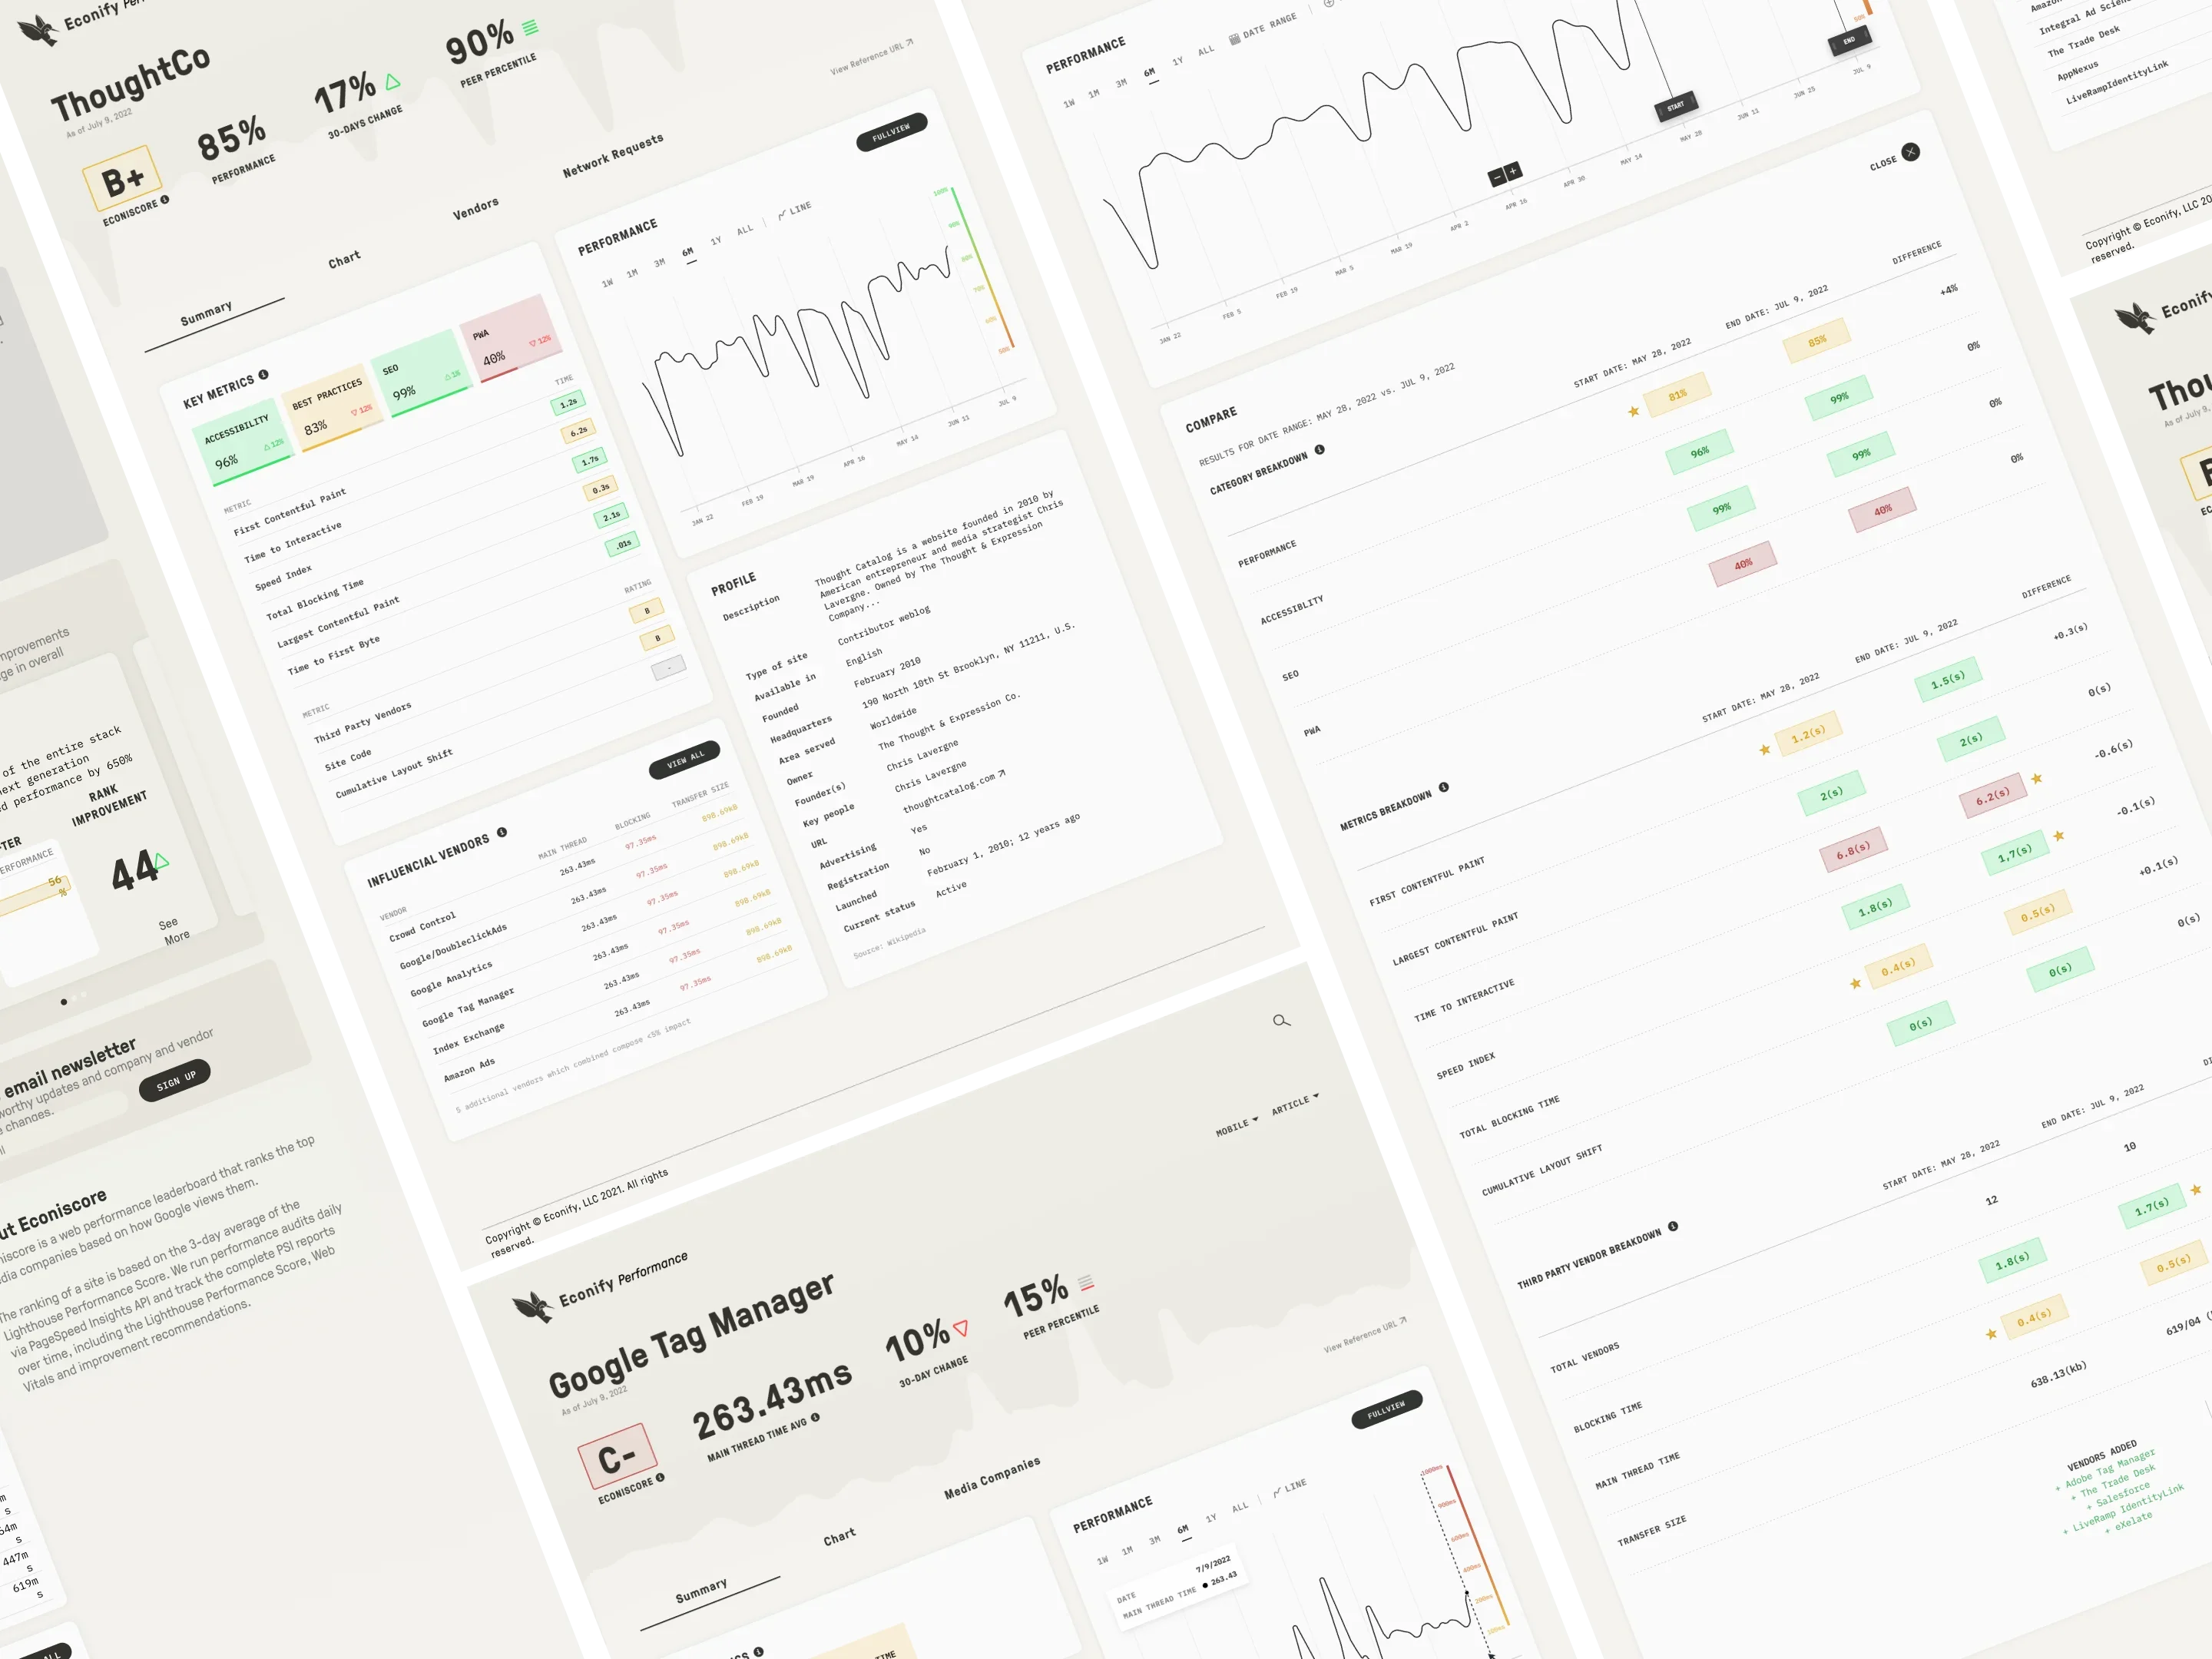
Challenge + Approach
Challenge
Performance data without shared context.
Website performance directly affects user experience, search visibility, and revenue—yet organizations often lack a clear understanding of what drives performance changes.
Product, business, and engineering teams relied on different metrics and competing narratives, making it hard to align on decisions and priorities.
Approach
Turn complex performance data into a shared source of truth.
Econiscore benchmarked media organizations against industry peers and exposed the impact of site architecture, third-party vendors, and business decisions.
The work included:
- Product and UX strategy
- Product design and data visualization
- Scalable interface and design systems
Core Product Experience
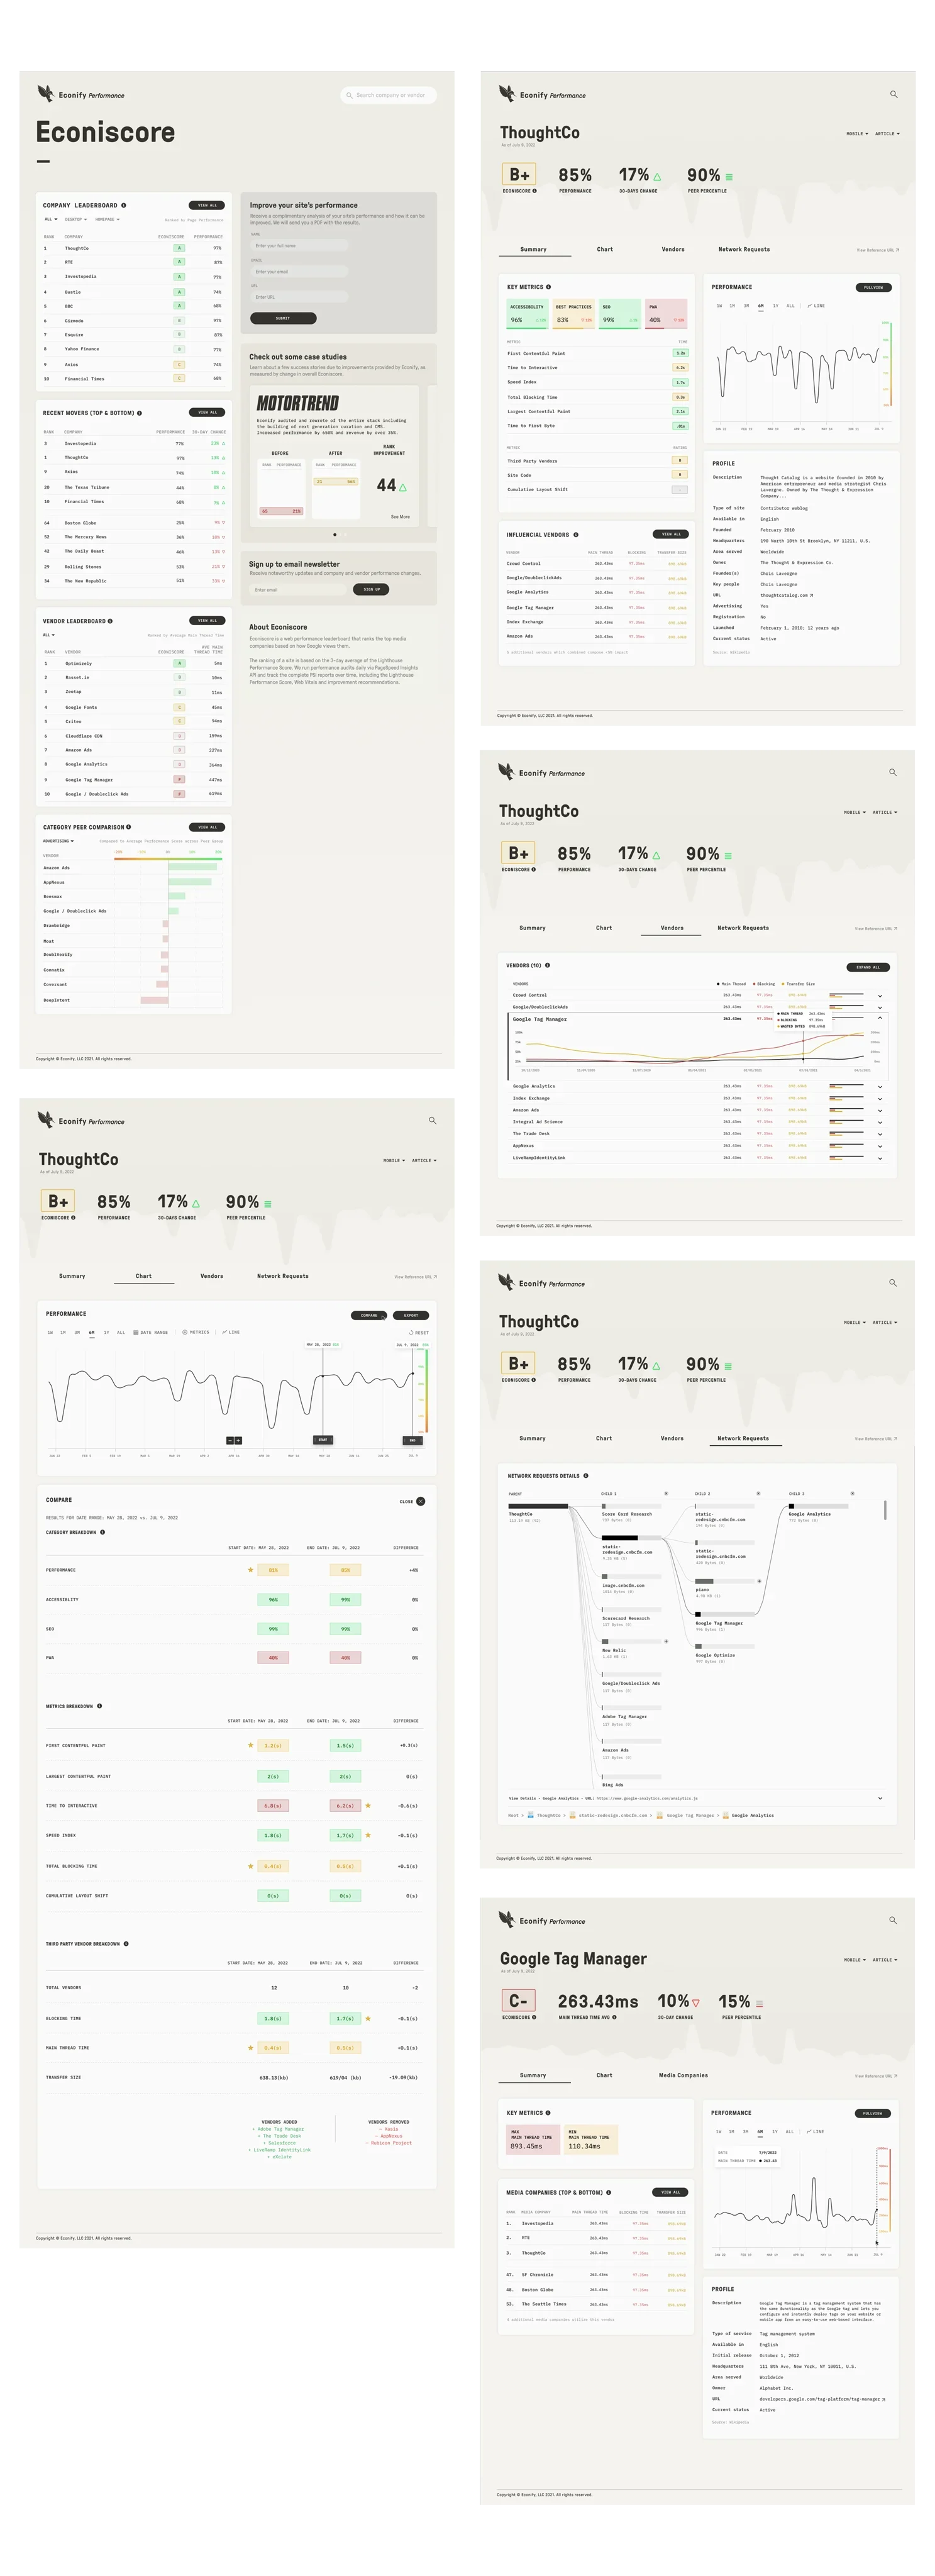
The consolidated product system brings the dashboard, company summary, performance chart, vendor analysis, network requests, and vendor summary into one continuous view.
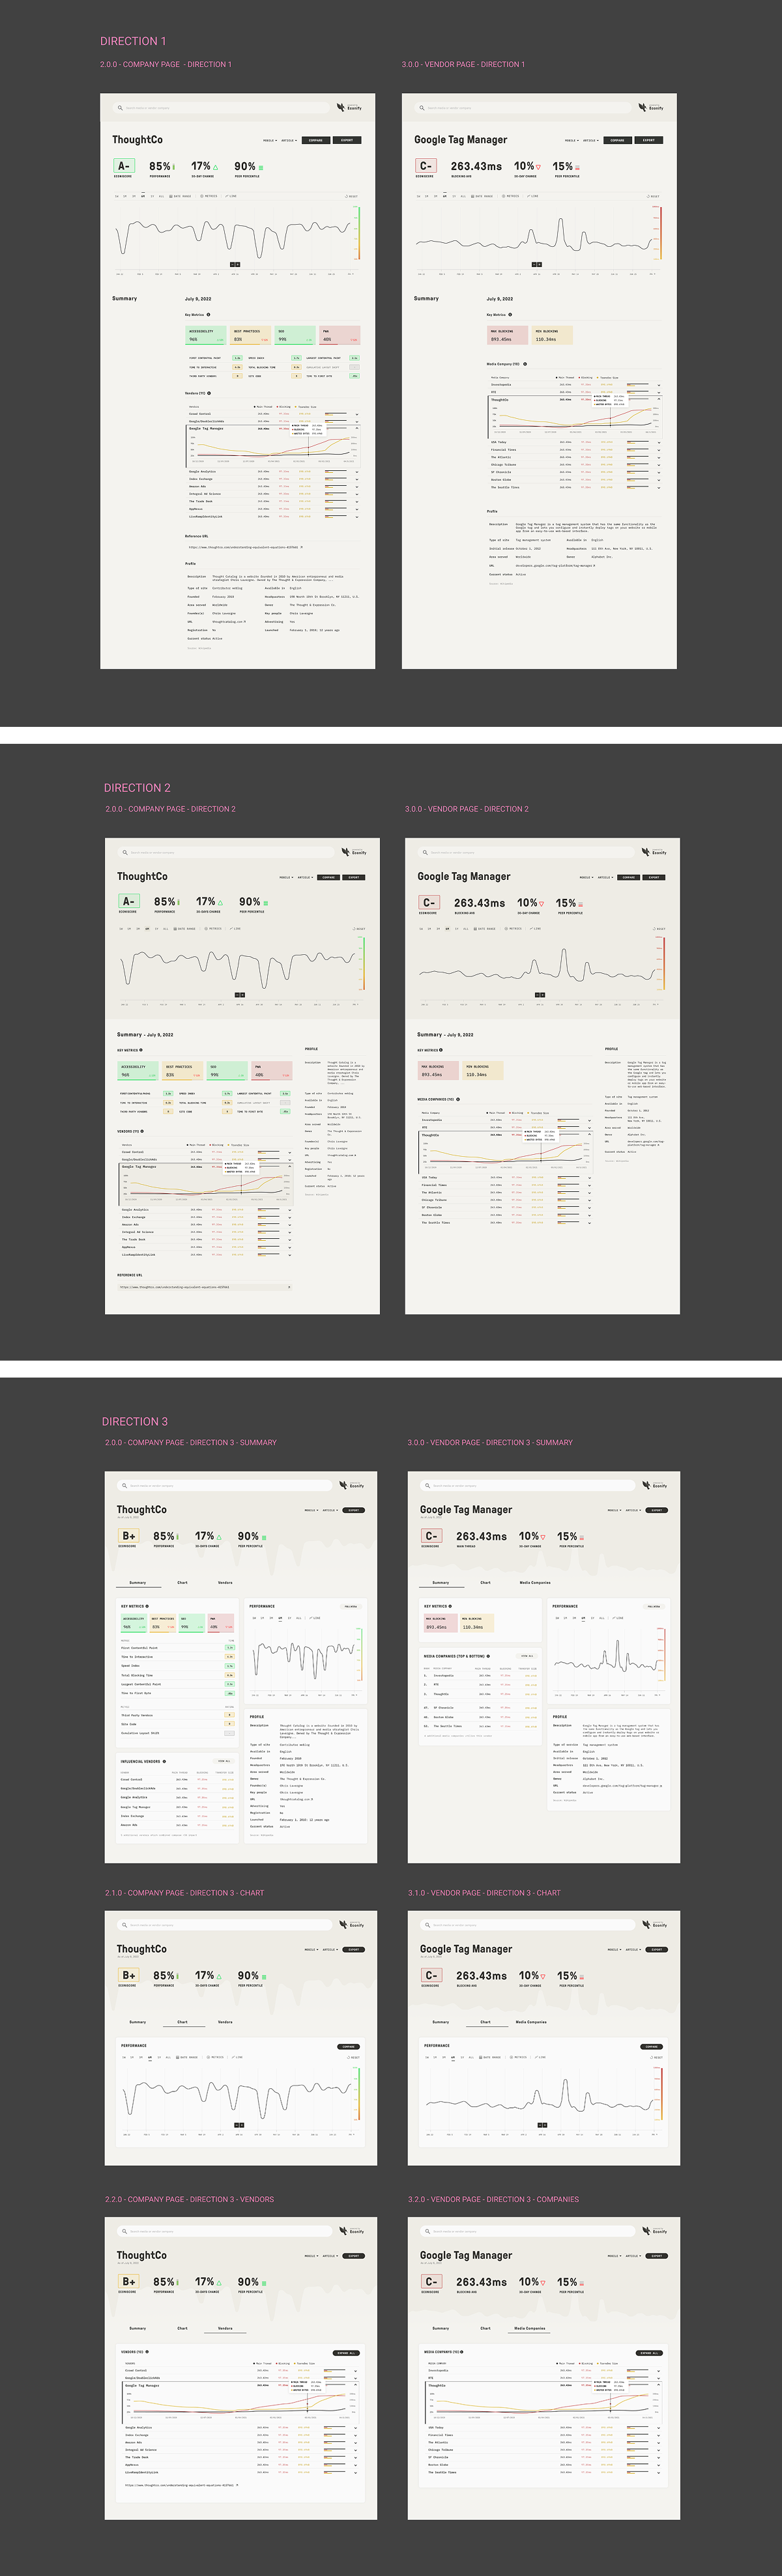
Design Exploration
Early company and vendor dashboard directions explored hierarchy, comparison, and how performance signals could become immediately legible.
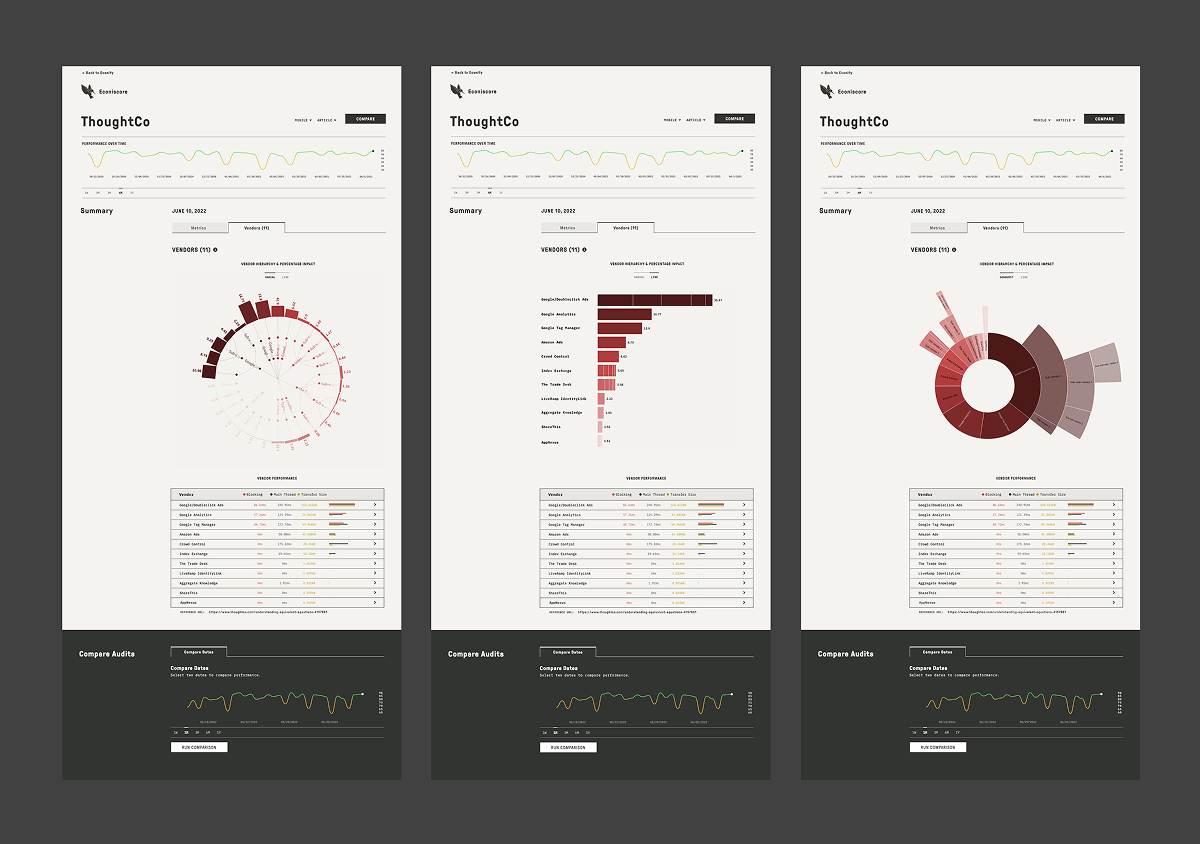
Vendor Visualization Exploration
Alternative chart forms tested how third-party vendor impact could be compared without losing technical context.
Design Spec
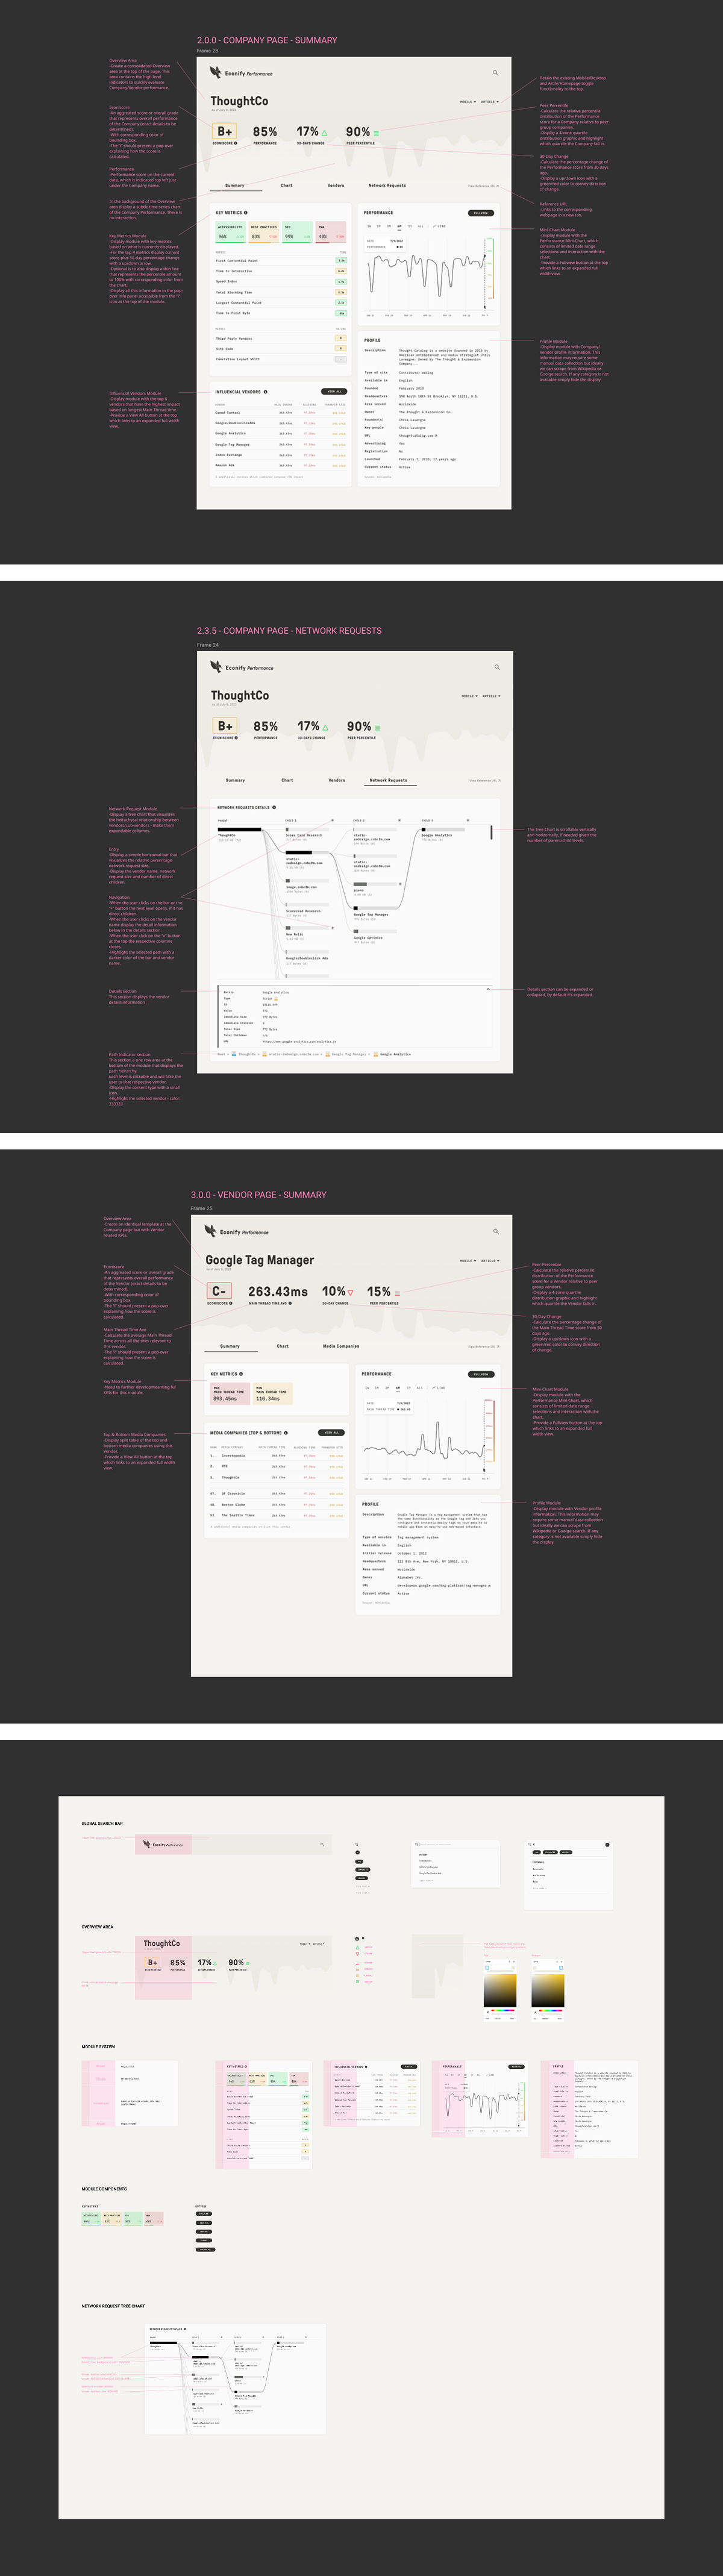
The final specification documented interface patterns and supporting visual-system decisions.
Outcome
Performance intelligence teams could act on.
The platform helped organizations move beyond isolated metrics and treat website performance as a strategic business advantage.